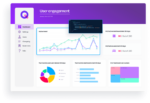
Visualize this: A new JavaScript framework that gives developers the ability to quickly create charts, graphs and more, and embed them in Web applications, makes its debut today.
The company behind the visualize.js framework is Jaspersoft, founded in 2004 around BI and analytics for software. It was acquired six weeks ago by TIBCO, long a leader in the messaging and Service-Oriented Architecture space.
Also today, TIBCO Jaspersoft is releasing version 5.6 of its core JasperReports Server with a host of new analytics features and calculations, as well as the JavaScript framework.
But it’s visualize.js (which uses the JasperReports Server APIs for data connectivity, in-memory analytics, visualization design and more) that has senior vice president and general manager Brian Gentile most excited. “With visualize.js, a new class of applications will emerge for a more helpful, guided user experience,” he said.
The framework enables those visualizations to be wrapped in JavaScript and dropped into a Web application running HTML on the front end, Gentile explained. “The chart or graph maintains an intelligent live link back to the server, so calculations can be refreshed, data can be refreshed. The chart is now part of that Web app and the logic,” he said.
One example of the power of the platform is in education software. One customer, Triumph Learning, uses visualize.js to track and measure students’ progress and growth on skills and standards, according to the TIBCO Jaspersoft announcement.
Another example given by Gentile is a travel application: “Today, a travel website asks where you’re traveling to and from, and on what dates. JasperReports Server can present you with more data that might help you make a decision. For instance, if you travel on these dates, here are the prices. You can optimize the trip for cost, frequency of delays at the airport, time of day you want to travel. There’s interaction. You can choose a fare and the application will give you dates and times.”
Other new features in version 5.6 of the BI platform are federated query connectors for virtually blending relations data with data from MongoDB, Hadoop or Cassandra; and improved native connectors for direct access to those databases for real-time reporting. New analytic functions and calculations give developers the power to build their own advanced algorithms for deeper data analysis, as well as new chart types and enhanced interactive reporting functionality to round out the release.
“We’re seen as a developer tool,” Gentile said. “Developers want to derive insight on the data their application collects, but writing your own reporting is onerous and brittle.”
Jaspersoft, headquartered in San Francisco, Dublin and Singapore, will be a product group within TIBCO for the foreseeable future, Gentile said.