The drive for innovation behind Lightning Chart – and its upcoming data analytics and dashboard solution, Dashtera – is rooted in the history of the company’s founder, Pasi Tuomainen. Though his family had an established electrical company in Finland — Pasi’s passion was always software. He found himself drawn to creating code rather than installing lights.
During his academic career in computer science and electronics, he was hired by a local medical technology company, where his work involved creating complex, demanding applications, including computer games designed for the rehabilitation of brain stroke patients.
“They needed to visualize EEG data from hundreds of different channels, like sensors attached to your head and muscles, with high sampling frequencies,” he recalled, noting that technology hadn’t been created yet. “So that was the ignition point of Lightning Chart.”
At first, Tuomainen said, it was a struggle. “The first two years, it was really challenging. There was practically no income. My wife almost kicked me out of the home. ‘Bring me money, or I leave.’ “
The company did gain traction, though, starting to build GPU accelerated data visualization components on the Windows C#/.NET platform with Direct3D, and along the journey added JavaScript charts with WebGL, and then created financial trading charts. They added “lightning fast” Python charting libraries last year, he said, and now Lightning Chart’s Dashtera analytics platform is in beta. “So this is a very wide set of high-end data visualization tools for a wide variety of industries.”
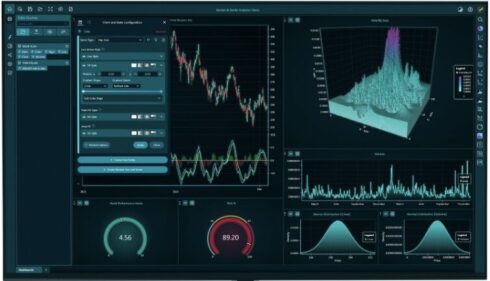
Dashtera is capable of visualizing up to a billion data points within a web-based user interface. Its core strength lies in its capability to visualize real-time streaming data efficiently, which enables building dashboard views for industrial applications, racing car telemetry, medical devices, or aircraft transmissions.
This tremendous speed is made possible by a proprietary, self-developed rendering engine, which Tuomainen called the “fastest technology available.” Comparative data shows the rendering performance of the engine drastically exceeds known competitors like Grafana, with Dashtera claiming to be almost 400,000 times faster in real-time streaming applications and over 3,000 times faster in static scenarios.
Beyond pure speed, the platform boasts a feature set for multiple use cases and delivers true data observability. These include detailed BI charting, extreme engineering visualizations designed for process control and industrial automation, finance and trading charting, and advanced 3D charting.
Dashtera is available as a web-based no-code system at dashtera.com, where users can create accounts and begin analyzing data immediately, and it can also be deployed as an on-premises solution. Besides uploading data files, it supports a variety of data connectors, including standard SQL databases, data lakes, and streaming data sources, making it easy to integrate with existing data architectures. The platform provides extensive tooling, with around 100 different charts available for creating fully custom, live scientific dashboards that can be shared.