
Over the past two years, the pace of innovation for AI code assistance has been nothing short of astounding. We’ve moved from “enhanced autocomplete” systems to ecosystems of AI agents capable of completing complex tasks and cranking out prodigious amounts of code. At the same time, developers are being asked to build, test, and deploy … continue reading

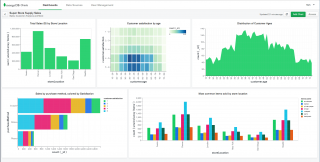
KUOPIO, Finland — LightningChart, the high-performance data visualization engine manufacturer trusted by globally recognized organizations like Raytheon, Lloyds Banking Group, the U.S. Army, and Tesla, today announced the launch of Dashtera, a real-time, web-based, no-code data analytics and visualization dashboard platform, optimized for industries that rely on understanding large, fast-moving datasets. Traditional dashboard tools often … continue reading
ScaleOut Software today is introducing Version 6 of its ScaleOut Product Suite, distributed caching and in-memory data grid software. This release introduces breakthrough capabilities not found in today’s distributed caching software products. At its core is ScaleOut Active Caching, a new technology that boosts performance by running application code directly within the distributed cache. It … continue reading
Plotly today announced Plotly Studio, an AI-native desktop application that generates visual data apps in just two minutes using nothing but datasets, alongside Plotly Cloud, a unified platform to share and manage apps. For Everyone with Data Plotly Studio requires no prompt hacking, terminal navigation, or Python installation. Yet the generated Python code provides unprecedented analytical capabilities … continue reading

Netlify announced it acquired FeaturePeek, a project that enables developer teams to preview frontend content. With the acquisition, FeaturePeek’s developer collaboration product is now a core capability within the next generation of Netlify Deploy Previews. The new generation of Deploy Previews offers live automated previews, a floating UI, feedback that is automatically synced to the … continue reading

The new Live Debugging Heatmap by Rookout is designed to visualize which applications are causing the most problems within a business. “We want to give meaningful insights in a quick and visually appealing way,” said Shahar Fogel, the CEO of Rookout. “We have unique insights into where software developers are spending the most time debugging … continue reading

Development tools provider Infragistics is announcing a new embedded business intelligence platform designed to give organization’s more insight into their data. Reveal is an embedded analytics/dashboard platform that aims to reduce the time and money spent on embedding business analytics into applications by letting developers use pre-built components. According to the company, Reveal can reduce … continue reading
Real-time visibility into their DevOps projects is a somewhat to extremely important goal for 84 percent of 200 North America respondents to a survey from SmartDraw Software, a provider of diagramming software. With DevOps projects growing more complex, and often involving multiple tool integrations, gaining visibility into those projects has become a challenge, even for … continue reading
In an effort to remove the technical barriers to data visualization, MongoDB has announced the beta release of MongoDB Charts, a native data visualization tool. MongoDB Charts will be apart of MongoDB Atlas, the company’s database-as-a-service. According to the company, MongoDB Charts eliminates the need to worry about code, tools, data movement or data duplication … continue reading
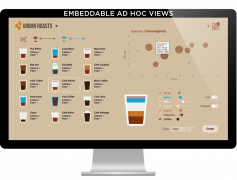
TIBCO announces the latest version of its embeddable business intelligence and analytics software. Jaspersoft 7 includes new capabilities designed to help developers differentiate their apps with data visualization. Features include the data visualization view is now available as a BI component enabling individual visualizations that can be integrated into the app experience. This was built … continue reading

JetBrains is introducing a new solution dedicated to data analysis and visualization. The company announced Datalore, a new web application designed to draw insights from raw data, simplify coding routines, and make intelligent decisions. The solution leverages machine learning to perform tasks, and currently focuses on Python development. “We’re launching this tool inspired by … continue reading

Data is overwhelming cybersecurity teams worldwide. Too much data is not necessarily a bad thing, but the daily barrage creates challenges stemming from the following questions: where is the data coming from, what does it mean and how can it be applied to keep companies more secure? Many in security operations are grappling with how … continue reading