Critical bugs, quality bugs and communication continue to be reported by Java developers around the world.
RebelLabs, which has been cranking out development research since it was formed in 2009, has released its 2013 Developer Productivity Report, which includes responses from more than 1,000 Java developers worldwide.
(Other news from the world of Java)
Among the responses, it was telling to see that a significant percentage of development groups are still experiencing pain around quality. A measurement of how often critical bugs were found after deployment showed that, 58% of the time, software is deployed without a critical, showstopper level of bug.
Those statistics also showed that the top 10% of performers delivered programs without major bugs 75% of the time, while the lowest performing 10% found major bugs in the wild 75% of the time, conversely.
Overall, that means around 60% of releases don’t contain major bugs.
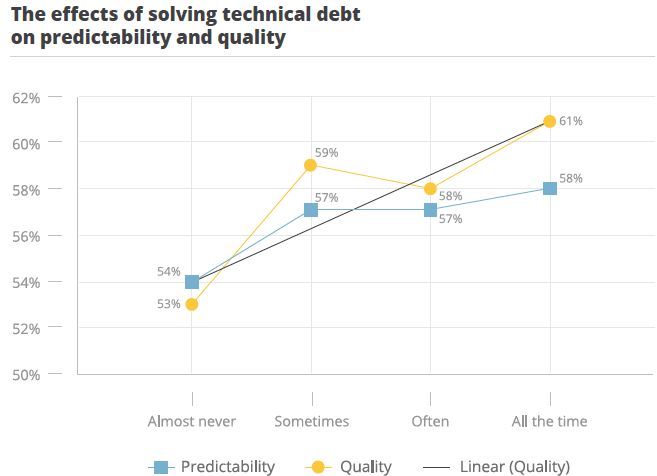
One of the key findings of the survey was the correlation between the removal of technical debt and the increasing predictability of release scheduling. This correlation, however, only works against developers, as ignoring technical debt was found to negatively impact release predictability. That means there is some level of diminishing returns with technical debt removal.
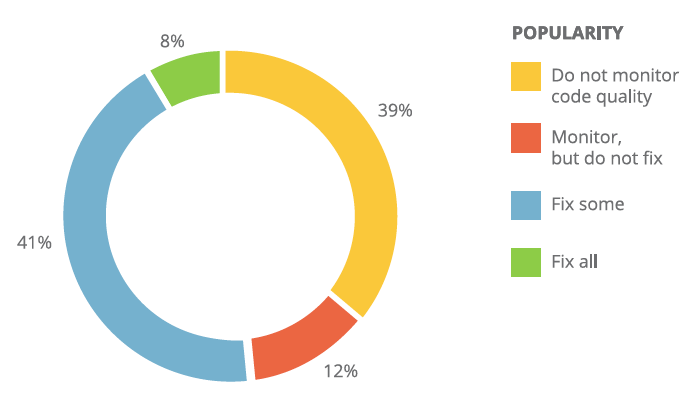
The question “Do you monitor and fix code quality problems?” was met with a nearly 50/50 split from the respondents. 51% of respondents either didn’t monitor (or monitored but did not fix) issues found through monitoring. Forty-one percent fixed some of the problems they found through code quality monitoring, while another 8% said they fixed all issues.
The affects on release predictability here was much stronger. Addressing technical debt only helps to stem problems, while directly addressing code quality seems to impact release predictability in an almost 1-to-1 ratio.
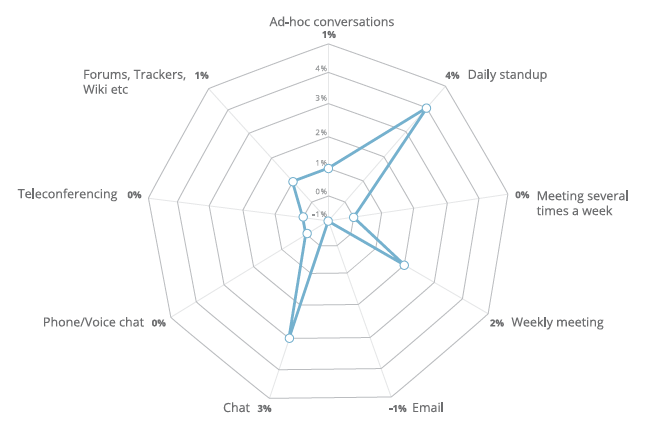
Communication is the key to any software development project involving more than one person. Of course, the various types of projects, Internet-messaging mediums, and time zones can greatly impact how developers talk to one another and work through their problems. This chart shows the effect of communications mediums on delivery predictability.
The results clearly show that a daily standup is the most effective way to communicate, but that IRC, IM and other Internet chat methods are almost as effective. Get your developers into that chat room, people!
#!
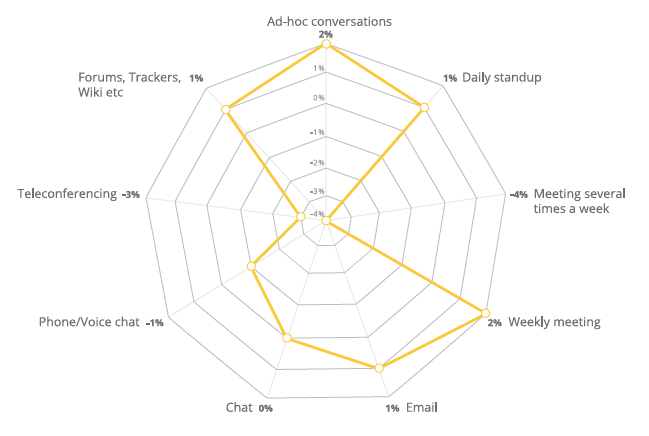
The second chart shows the effects communications mediums have on code quality, where weekly meetings and ad-hoc conversations are most effective.
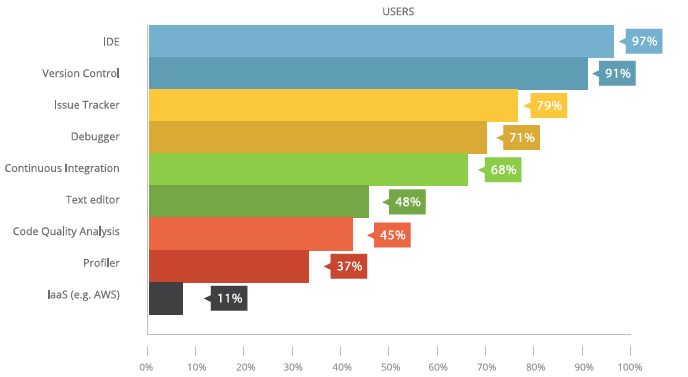
With so many tools in every developer’s chain, it’s difficult to tell which ones are actually improving overall product quality and predictability. This graph shows the effects various tools have on predictability, and that version control and IDEs are still the kings of developer tools.
These three charts show the popularity of various tools with developers. Few surprises, as JIRA, Subversion, Git and Jenkins walk away with the prizes for most popular tools.
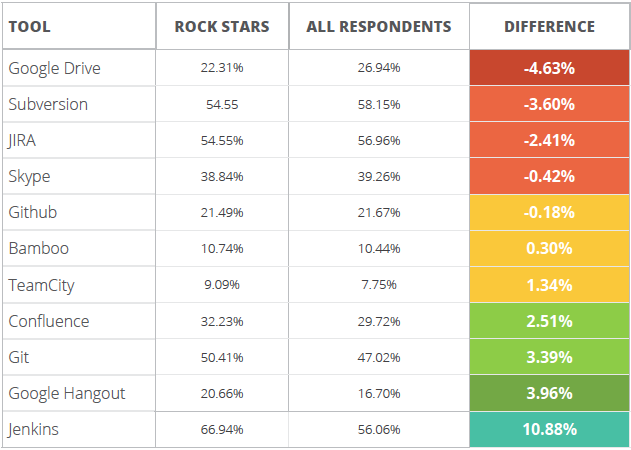
This final chart, however, shows which tools were favored by the “rock stars” of the survey. These respondents were in the top percentage of the quality and predictability portions of the survey, and this list shows which tools they used that others didn’t.