Grafana Labs is hoping to make it easier for companies to manage the end user experience for their applications. To achieve this, the company launched Grafana Cloud Frontend Observability, which enables companies to monitor frontend health, investigate frontend issues, resolve errors, and query, correlate, and visualize frontend telemetry in Grafana.
According to Grafana, today it’s common for frontend applications to run more of their code on the end users’ device. Since users can be accessing the app from various devices, browsers, and operating systems, or even while on different internet bandwidths, ensuring compatibility is a challenge.
The new solution will measure and report on Web Vitals like Time to First Byte, Largest Contentful Paint, First Input Delay, and Cumulative Layout Shift.
This data can be “sliced and diced” across any dimension, depending on what matters most to the business. It can also be useful in determining how different users interact with the app.
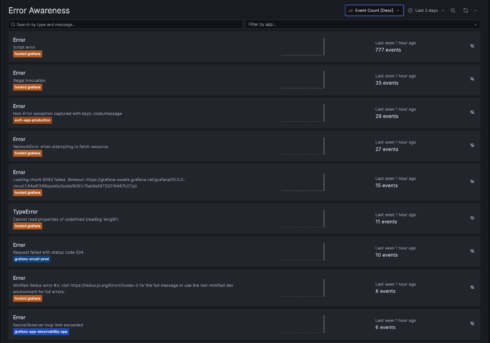
To make it easier to track down errors, it groups errors based on similarities and also ranks them by volume and frequency so that developers can see what URLs or browsers have the most errors and investigate accordingly.
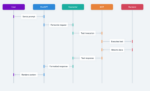
It also allows drilling down into specific user sessions based on things like application names, browser type, and timeframe, which can also be helpful in investigating issues.
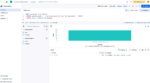
All observability data is stored in Grafana Cloud Logs, which allows teams to turn data into custom Grafana dashboards that can then be shared with team members and stakeholders.
“The frontend of a web application is the part that users directly interact with. It’s the last mile of the digital service you deliver to your customers and it’s directly associated with customer satisfaction and business objectives. Knowing performance metrics such as CPU or memory is helpful, but at the end of the day, what you care most about is if the user experience is affected,” Grafana Labs wrote in a blog post.