KubeMQ announced the most recent enhancement to the KubeMQ Dashboard that turns it into a complete command center for handling microservices connectivity.
The upgrade introduces two major features: auto-discovery and charts, offering users immediate insights and visualization abilities to optimize their microservices environment.
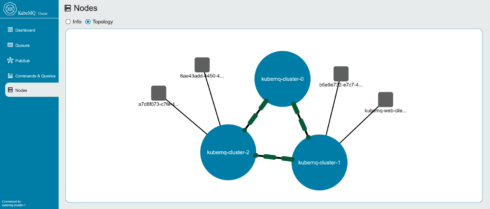
With the new auto-discovery feature, the KubeMQ Dashboard provides users with an intuitive and real-time view of microservices connections. Users can now easily identify connectors as senders and receivers for each queue or channel.
This granular visibility empowers users to quickly troubleshoot and optimize their messaging infrastructure. It can also identify which clients or connectors are connected to each node in the KubeMQ cluster. This detailed view allows teams to better understand how efficient the workloads in their clusters are to ensure optimal performance and scalability for microservices architectures.
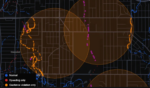
In addition to its auto-discovery feature, the KubeMQ Dashboard now offers charts that yield significant insights into messaging activity over time, such as showing the number of messages and the volume of data moving in and out of the microservices environment.
Through data visualization, users can readily observe the performance trends of their microservices, identify possible bottlenecks, and make informed choices to enhance their messaging infrastructure. The introduction of the charts feature adds clarity and transparency to microservices connectivity, simplifying system monitoring and management.