Some of you may be familiar with the SharePoint developer dashboard from SharePoint 2010. While sometimes useful, that version of this tool had some limitations and resource-consumption issues that prevented it from being widely used. The new version included with SharePoint 2013 is much improved, and anyone serious about SharePoint development or administration should become familiar with the basics of putting it to use.
There is no option for enabling the developer dashboard in SharePoint Central Administration. Instead, the best method is to use PowerShell. To enable the developer dashboard, open the SharePoint 2013 Management Shell and enter in these commands (or similar commands if you find a number of scripts for this purpose):
$devds = [Microsoft.SharePoint.Administration.SPWebService]::ContentService.DeveloperDashboardSettings
$devds.DisplayLevel = “On”
$devds.Update()
The SharePoint 2010 version of the developer dashboard had three different options for the DisplayLevel: On, Off and OnDemand. In 2013, the OnDemand option has been deprecated and does the same thing as On. To disable the dashboard after you are finished using it, simply use the script above but replace $devds.DisplayLevel = “On“ with $devds.DisplayLevel = “Off”.
Enabling the Developer Dashboard will cause an extra icon to appear in the upper left hand of SharePoint pages. It is important to note that once you have enabled the developer dashboard with this script, this new icon will appear for all users, so it is not advisable to leave it enabled all the time in a production environment.
Dashboard not enabled:
Dashboard enabled:
In the 2010 version of SharePoint, clicking on this icon would append data to the end of the page you were viewing, which sometimes caused issues with formatting and page loading. In the 2013 version, clicking this icon will open an entirely new window like this: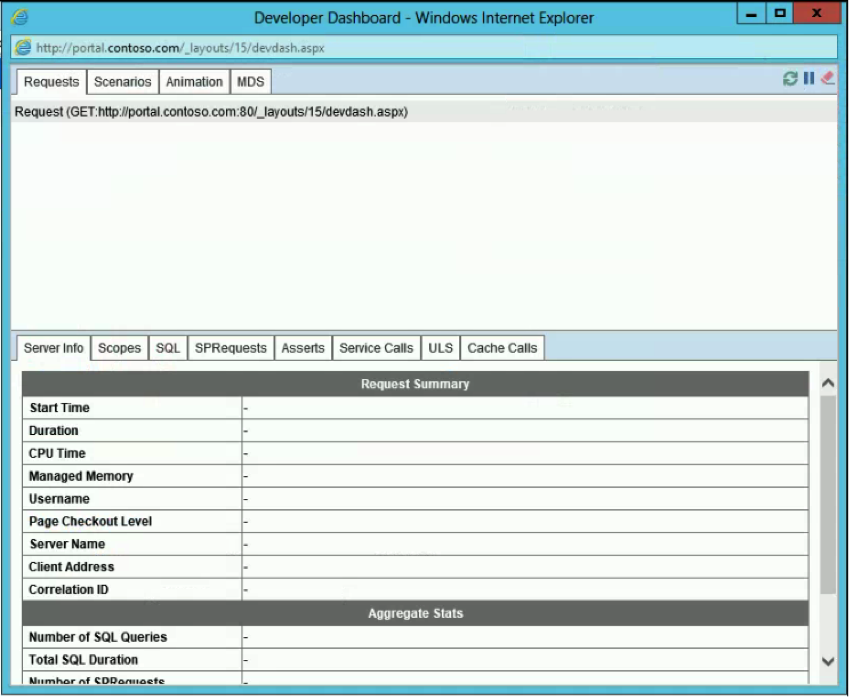
You might notice that most of the information seems to be blank. Under the request tab you will see a list of pages that are available for the dashboard to analyze. If you load or reload another SharePoint page after the dashboard is open, it will appear in this list, and clicking on its URL will populate the information.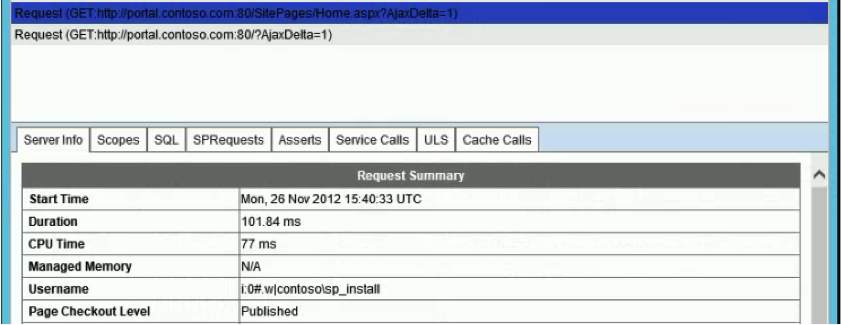
If loaded pages stop appearing in the Requests list, try clicking on the refresh icon in the dashboard corner.![]()
The green arrow is the resume option and toggles with a pause icon, allowing you to control when pages are being captured in the tool. The eraser icon will clear all the current requests and their information from the dashboard window when things start to get cluttered.
It would be impossible to list all the ways the information provided by the dashboard might be helpful to you, but as you can see, there are a number of things that might be useful almost immediately. Things like the duration of the page loads and the Page Checkout Level are useful as quick troubleshooting and performance-tuning options. Another very helpful property of this dashboard is the ULS tab. This tab exposes the section of the standard trace logs that pertain to this page load, so you can sometimes avoid digging through a large text file and go straight to the information you need.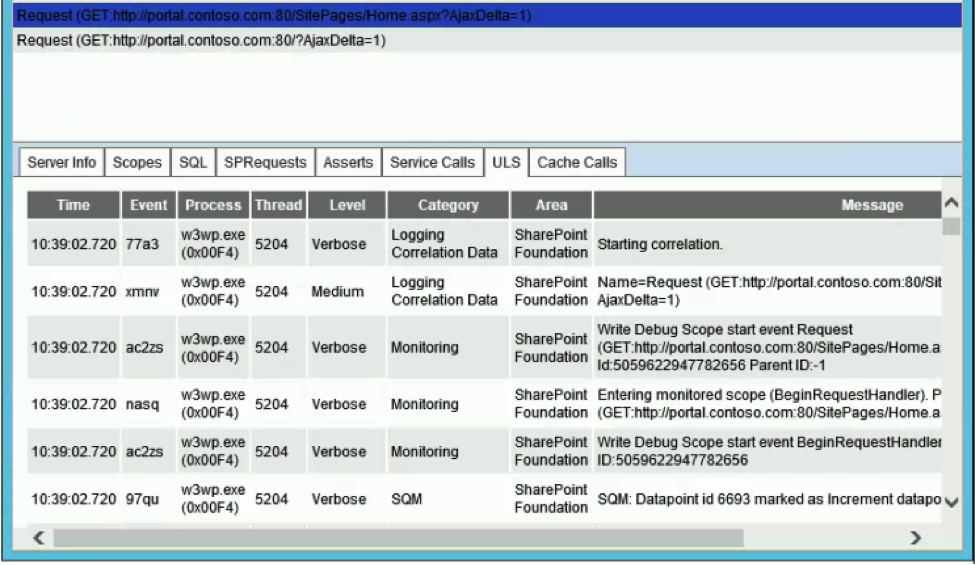
The developer dashboard was a much-underused option in SharePoint 2010 because of its awkwardness and performance impact. The SharePoint 2013 redesign not only takes care of those issues, it also adds a lot of enhancements to make the dashboard more useful and compatible with different browsers. Take the time to explore it in your test or development farm, and soon it will become a staple feature for your work.
Steven Wilson is a consultant with SharePoint911, a Rackspace company.