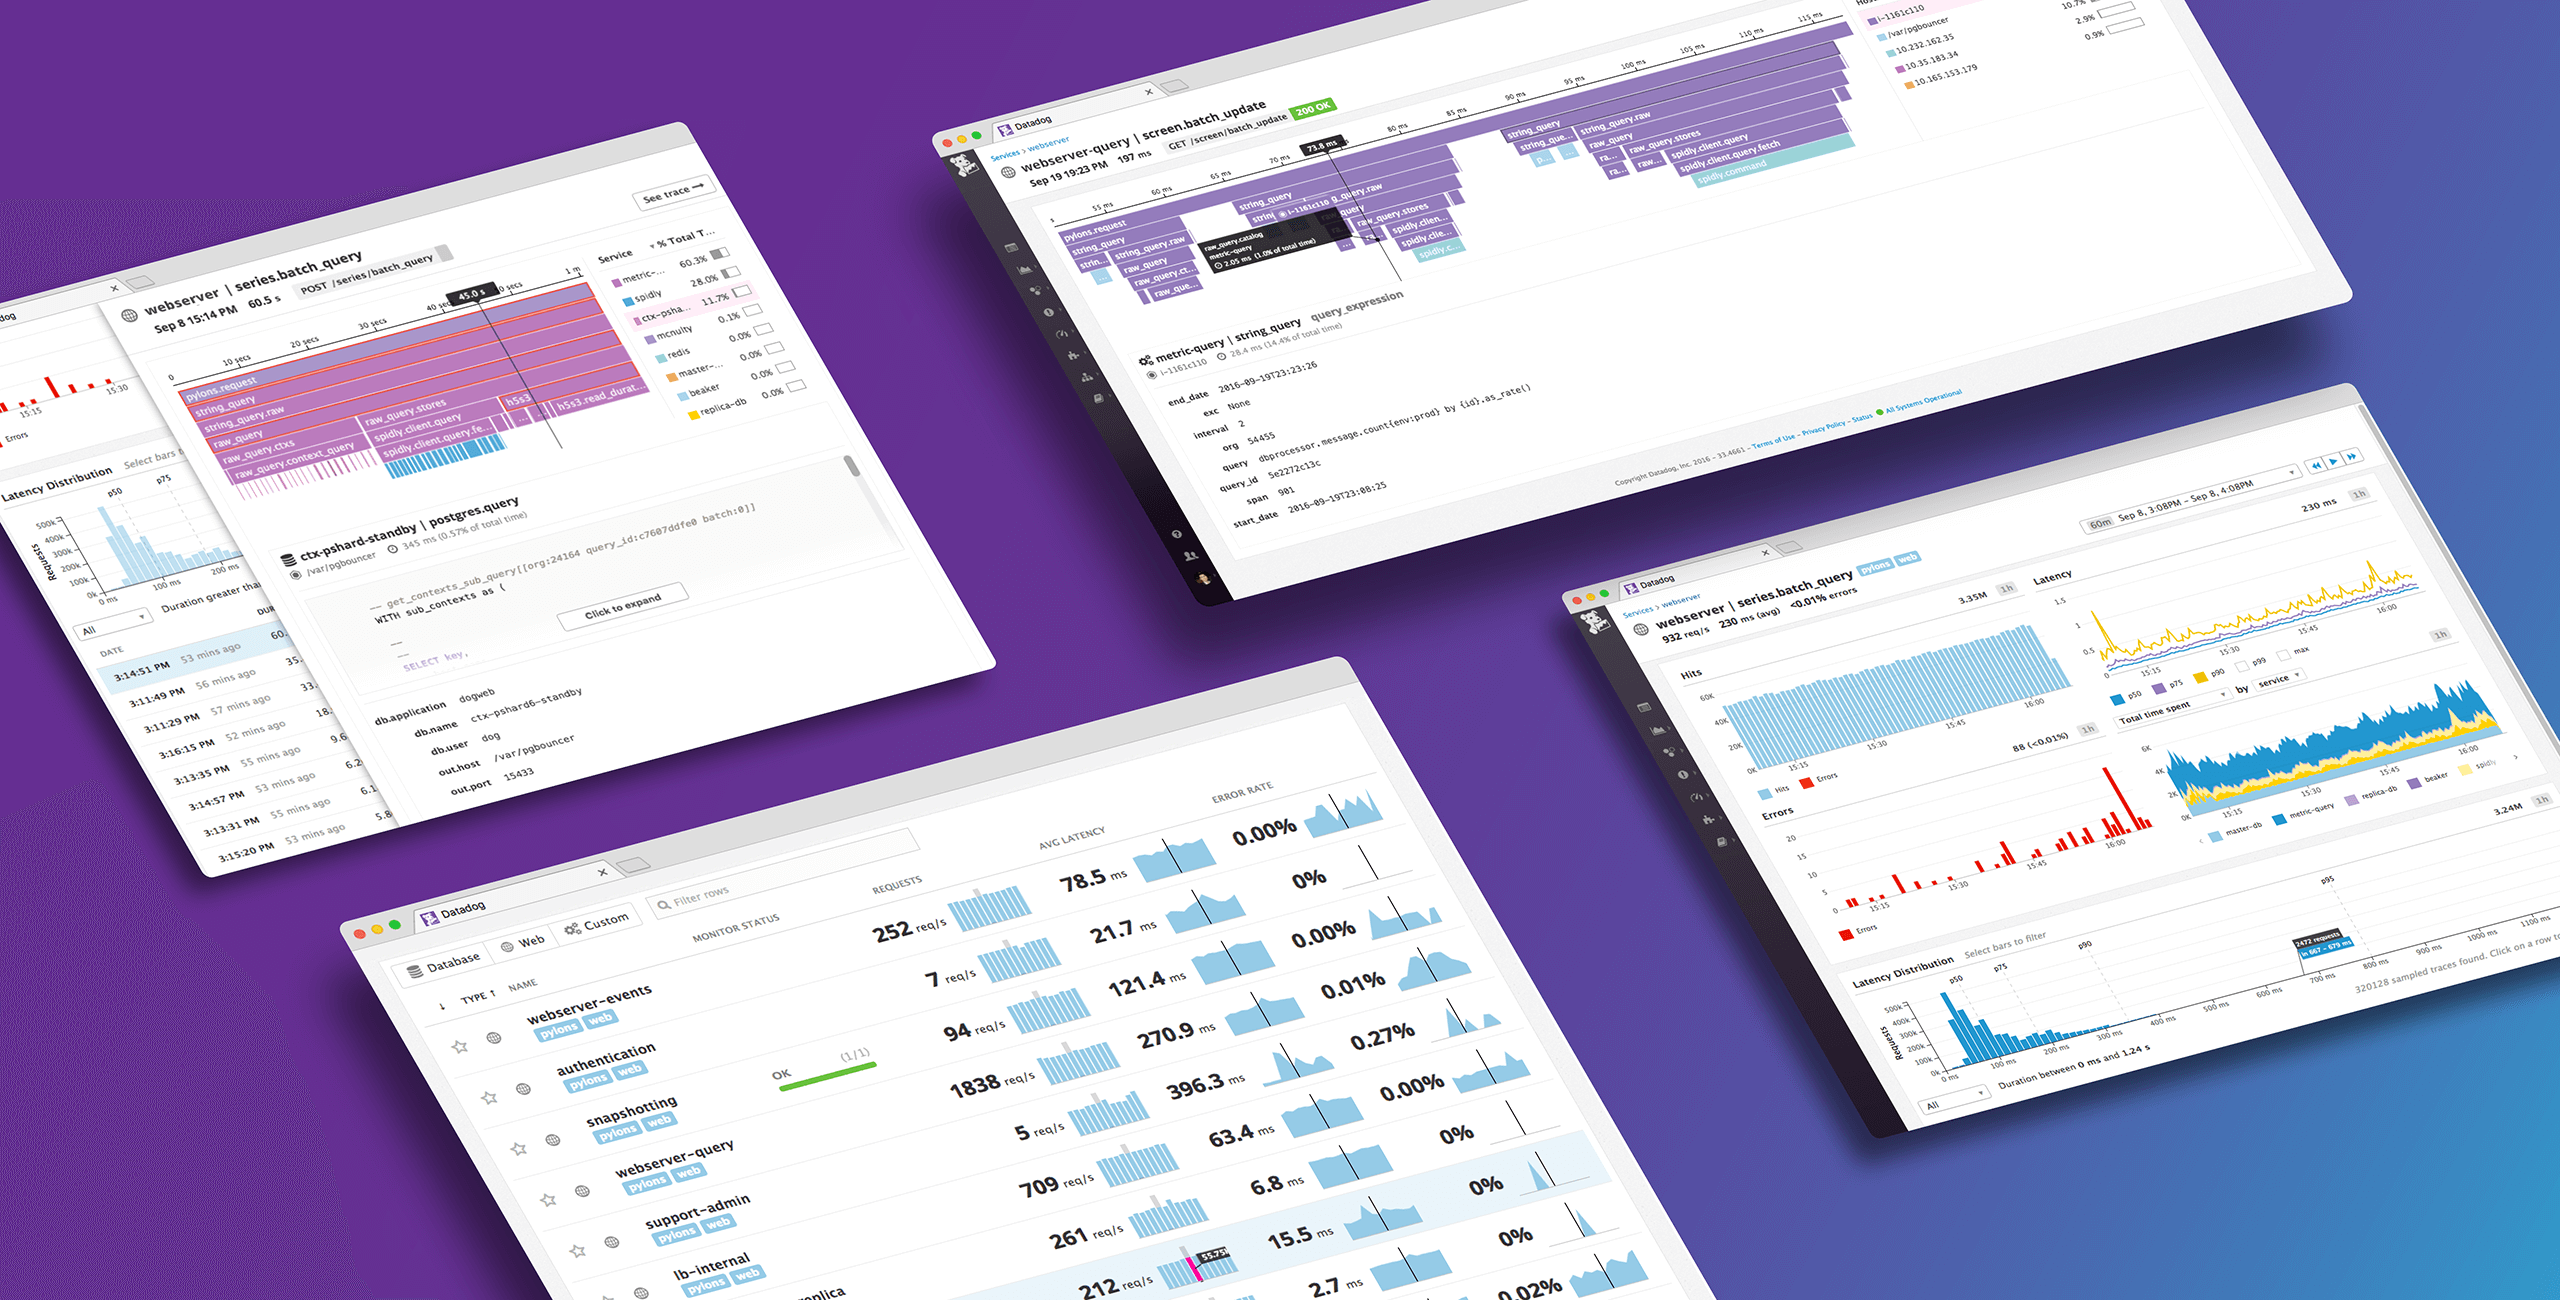
Datadog wants to give DevOps team a single-pane-of-glass view into their infrastructure and applications, whether they are running across hybrid clouds, microservices or containers. The company announced the Datadog Application Performance Monitoring (APM) solution to provide better visibility and faster issue resolution.
“Regardless of the setup, the ability to monitor changes in infrastructure and applications simultaneously will tighten the feedback loop even further and lead to faster issue resolution times,” said Albert Wang, product manager of Datadog APM. “With Datadog APM, DevOps can easily monitor application health metrics such as latency, throughput, and error rate. They can also identify bottlenecks such as slow-running code, slow database queries, and external services without knowledge of the underlying code.”
(Related: Dynatrace hardware visually alerts developers of DevOps problems)
According to Wang, one of the biggest features of this release is its distributed tracing capability, which provides sophisticated insights. “The popularity of event-driven, asynchronous programming and Go-based microservices have been a blessing and a curse for developers who have difficulty following requests across services, hosts, and databases,” Wang said. “APM ties closely with the rest of Datadog, which means developers gain the ability to easily customize dashboards to fit their workflow. They can also easily monitor their application infrastructure and receive rich alerts in Slack, e-mail or SMS.”
Other features include automatic tracing; flame graphs for identifying code paths; customizable dashboards; built-in collaboration; smart alerting; machine-learning-based anomaly detection; and tag-based aggregation of performance data.
Wang explained that Datadog APM is freshly out of its beta phase, so the company will be listening to customer feedback in order to provide support for more programming languages and monitoring capabilities.


