Grafana Labs has made a number of updates to its observability portfolio this week at its virtual ObservabilityCON conference. The updates include the release of Loki 2.0, Grafana Tempo, Grafana 7.3, new plugins, and Grafana Metrics Enterprise.
Loki 2.0 includes improvements to the query language, allowing users to transform logs and extract additional labels, according to the company. These improvements help keep Loki cost-efficient and easy-to-use, while also providing the ability to query, analyze, and aggregate log data in new ways.
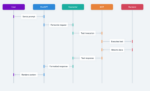
Grafana Tempo is a new open-source distributed tracing backend. It is designed to correlate metrics, logs, and traces, and make it easier and faster to troubleshoot by narrowing in on a specific trace. It is also deeply integrated with Grafana, Prometheus, and Loki, Grafana Labs explained. It can be used alongside any open source tracing protocol, such as Jaeger, Zipkin, and OpenTelemetry.
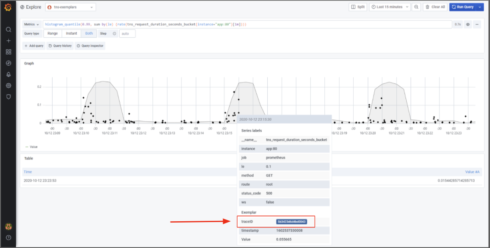
Grafana 7.3 offers a seamless experience between Grafana and Tempo using exemplars, which enables a user to find a trace that exemplifies a pattern and accelerate the debugging process by jumping from metrics to relevant traces to specific logs. Other new features include cell hover in the table panel, more transformations, better exporting features, performance improvements for Cloudwatch, and more.
Grafana also added a number of new plugins, including Wavefront, GitHub, Snowflake, and MongoDB. In addition, it updated its Oracle, ServiceNow, and Dynatrace plugins. The company also added support for alerting in all of its enterprise plugins. “A key part of our observability strategy is working with our customers and community to extend Grafana with various data source plugins, so you can compose your observability solution to include data from whichever tools you’re currently using,” Grafana Labs wrote in a blog post.
Grafana Metrics Enterprise is a new product that enables Prometheus-as-a-Service for large organizations running at scale. It is designed to help those companies scale out their current Prometheus installations.
More information on the updates are available here.