New Relic is continuing to make its full-stack observability vision a reality with the release of New Relic Explorer. The new solution comes with new visualizations and capabilities that give engineers a complete view of their entire IT estate.
The company announced its plans to reimagine full-stack observability last year by providing a unified platform where engineers can visualize, analyze and troubleshoot the entire software stack as well as connect to infrastructure health, application performance and end-user behavior.
According to the company, there is just too much going on within an IT environment for teams to fully understand. The use of thousands of services, hosts, and containers as well as fragmented and ad hoc tools is limiting teams’ ability to manage everything, and see what’s really happening within their systems, Buddy Brewer, global vice president and field CTO for New Relic, explained.
“The addition of New Relic Explorer to Full-Stack Observability adds more capabilities to make it even easier to break down silos, understand the health of your system at a glance, and uncover unknown relationships, blindspots, and gaps. Through an intuitive experience, all your telemetry data can be visualized and explored, in one place, regardless of source, and emerging issues and changes can be discovered in real-time without relying on static, pre-configured thresholds or dashboards, so you can get your system back to full health before your customers ever notice,” Brewer said.
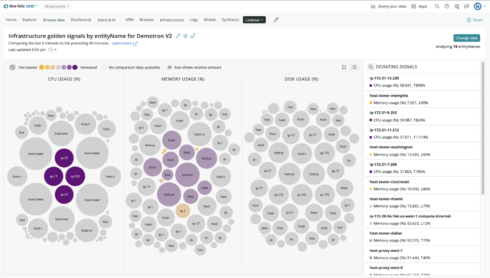
The new capabilities include New Relic Lookout and New Relic Navigator. Lookout enables teams to uncover blind spots and unknown relationships through estate-wide, real-time visibility into telemetry data changes and zoom in capabilities that help pinpoint correlation, abnormal history and traces.
Navigator enables users to explore all entities at a glance with intuitive visualization and labels based on alert connections. For instance, it displays application and service health in red, yellow or green so teams can quickly see the most important issues and investigate further.
“COVID-19 is accelerating the rate of digital transformation, while in tandem, modern IT environments are increasing in scale and complexity. Engineering teams are being asked to manage more than they ever have before – and are at a point where they are physically unable to track all of the changes and dependencies,” Brewer said. “The real benefit of observability is opening up the ability to ask questions of your system in real time (or allowing AI to do it for you) through the data it throws off–aggregated (aka metrics), events (discrete predefined high-value occurrences defined by engineers), logs (a line-by-line history of everything happening in the instance), and traces (end-to-end stitched paths of a trip through the system).”