An update to PlanetScale called Insights Anomalies introduces smart query monitoring to detect slower-than-expected queries in databases.
PlanetScale’s Insights Anomalies is designed to simplify the process of assessing a database’s health and troubleshooting issues, according to the company in a blog post. The primary goal is to offer a clear overview of the database’s status and to make the troubleshooting process easy.
PlanetScale believes that it’s not only important to detect anomalies in a database but also to understand their root causes. Insights presents relevant metrics for each anomaly, including high-level query metrics such as rows read and written per second, utilization metrics for database resources (such as CPU and disk usage), and information on backups and deploy requests that might impact shared resources.
Insights records and retains precise query counts for every query pattern in a database. This allows for a comparison between the execution rate of each query pattern and the overall health metrics of the database, enabling the identification of highly correlated queries.
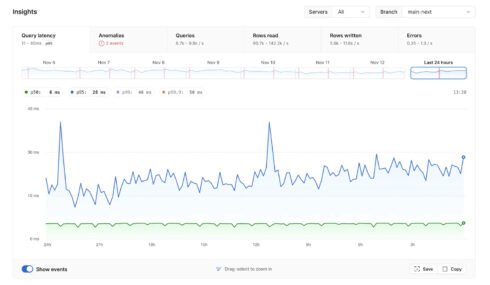
PlanetScale Insights provides users with a detailed examination of all active queries running against their database through an in-dashboard tool. This tool allows for the identification of queries exhibiting issues such as excessive frequency, prolonged execution times, large data returns, or errors. Users can navigate a performance graph to pinpoint when a query was impacted and, when applicable, the associated Deploy Request. The tool also presents a list of all queries performed in the last 24 hours, sortable by metrics like rows read and time per query for thorough analysis.
With this integrated tool, users can easily diagnose query issues, streamlining the optimization of individual queries without extensive investigation. The Anomalies tab further alerts users to any active issues, flagging queries running significantly slower than expected.