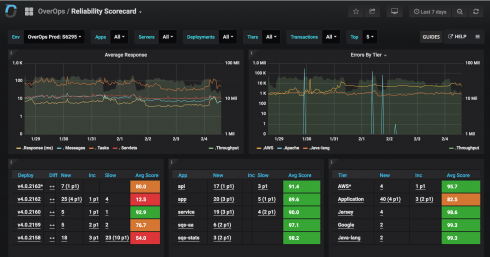
Software reliability platform provider OverOps has announced new Reliability Dashboards to give QA, DevOps and Site Reliability Teams more insight across their pre-production and production environments. The dashboards include new machine learning-based scoring capabilities that automatically detect anomalies and prioritize them based on impact.
“Most organizations are facing two primary dilemmas in their software delivery: ‘how do I know if a release is ready to move forward, and once it has, how do I know how well it’s doing?’ Even with common testing and monitoring tools in place, there’s still a large degree of uncertainty once code is released into the wild,” said Tal Weiss, CTO and co-founder at OverOps. “OverOps now arms our customers with concrete data in an easily digestible format to validate the quality of any code or infrastructure change to an environment.”
According to Weiss, OverOps had previously only been able to find and fix production errors, but this new solution is meant to stop errors from happening in the first place.
Other features include reliability scorecards and release certification, true root cause drill-downs, and reliability trends over time. The scorecords and certification uses scores such as newly introduced errors, increasing errors and performance slowdowns so that DevOps teams can quickly go in and see what requires their immediate attention. In addition, it includes new Jenkins integrations to provide insight into any anomalies introduced in a release, OverOps explained.
True root cause drill-down provides a dashboard for gaining deeper visibility into low-scoring deployments, apps and infrastructure tiers. It will also show corresponding anomalies, code and variable state at the moment an error happened.
Lastly, reliability trends over time tracks and identifies patterns so teams can compare releases and see how well apps and deployments do over time. It will include error volume, unique error count, newly introduced or increasing errors and slowdowns.


