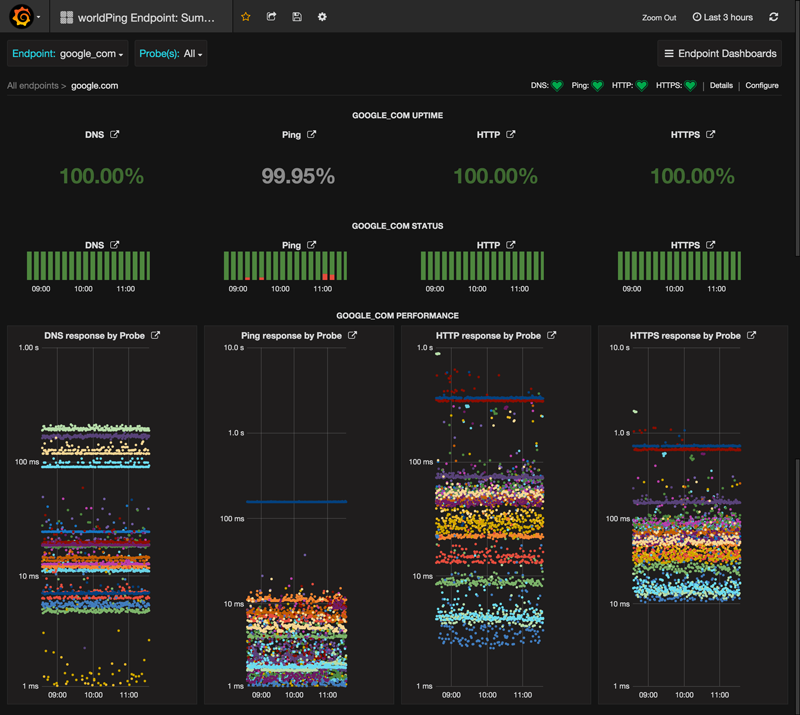
Raintank, the open SaaS monitoring company behind Grafana, has been busy with the beta release of Grafana 3.0, a strategic collaboration between raintank and Intel, and the beta launch of Grafana.net.
Grafana was created in 2014 by raintank cofounder Torkel Ödegaard, and it has become the de facto open-source solution for visualizing cloud telemetry data, with the goal of helping the Grafana community discover, create and share Grafana plug-ins and dashboards.
“Monitoring companies have tons of integrations and plug-ins, but we think that the existing world and community and ecosystem of open source for monitoring, particularly Grafana users, can really come together and collaborate and create an experience that rivals those tools,” said raintank CEO Raj Dutt.
(Related: The importance of software licensing flexibility)
Grafana.net is a place where teams can consolidate traditionally disparate data into a single platform. They can visualize their local data alongside a hosted and scalable metric store; share dashboards, panels and apps with the Grafana community; and create their own integrations for the world to use.
One of the goals behind the launch of Grafana.net is to help organizations that have lost control of their monitoring. These companies, said Dutt, are stuck with proprietary tools that can’t handle today’s public and private cloud deployments.
“It’s gotten too expensive and too complicated, and it’s just a world of proprietary options that don’t interoperate,” he said. “We want to help people take back control of their monitoring and democratize their metrics.”
The raintank team decided that it was time to improve extensibility through plug-in support. Grafana 3.0 comes with a completely revamped plug-in SDK/API. The team also refactored its data source plug-in architecture and added two new plug-in types: panel plug-ins, which allow for adding new panel types to the dashboards, and app plug-ins, which are a way to provide an experience right within Grafana.
Grafana.net currently offers a central repository where the community can come together to discover and share plug-ins and Dashboards for Grafana 3.0 and above.
The announcement of Grafana 3.0 and the launch of Grafana.net was made at Intel’s Cloud Day at the end of March. During this presentation, Intel announced that it was going to collaborate with raintank to integrate snap into Grafana. Snap is an Intel open-source project for a telemetry framework that provides access to data on the states and capabilities of underlying infrastructure.
Dutt said snap could become a centerpiece for raintank’s stack, and that the company’s excited that snap and Grafana are going to be getting a tight integration.
Overall, Dutt said this release was the result of 1,500 changes from 30 contributors in multiple countries. Grafana is being used for application and infrastructure monitoring, home monitoring and sensor data, he said.


