Developers complete tasks. Their managers oversee the work and allocate resources as needed. They work in project-management tools that help them get their jobs done through task assignments, burn-down charts and more. In large organizations, there will be multiple teams working on multiple projects, each generating their own data as to how their work is going.
But how do managers at the highest level of an organization—who must keep their eyes on what’s good for the business, not merely one project or another—make sense of all the data at their disposal? Traditionally, this has been done through weekly executive meetings, with vice presidents reporting on how the teams under them are performing. This, though, can lead to unpredictability, and if there’s anything an organization values, it’s predictability.
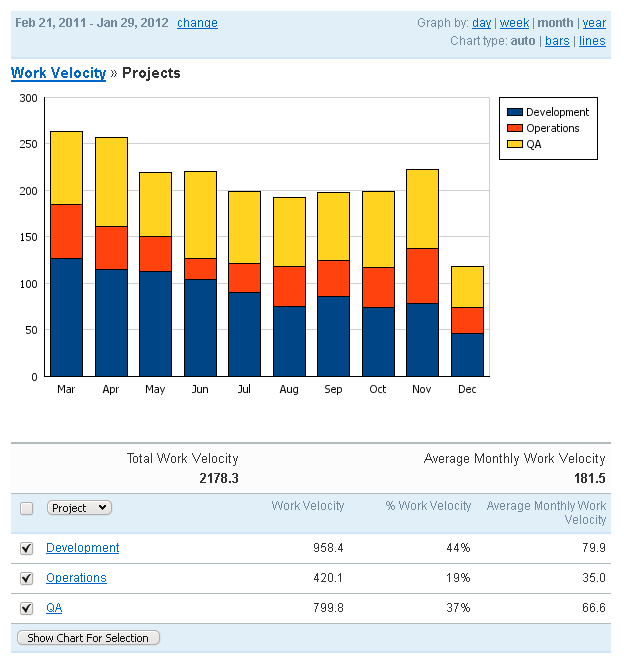
To that end, Acunote, a project-management software company, today is releasing a solution called Management Analytics, which aggregates and presents the “How are we doing?” data in ways that executives can act on it to make key business decisions.

“In companies with multiple business units, the problem is allocation of resources,” said Gleb Arshinov, CEO of Acunote. “A project manager will pull as much as he can for his unit, but sales from that unit might be only 1% of the total business. That unit might take up to 50% of available resources. That’s good for the unit, which will be able to get its work done on time, but it’s bad for the overall business,” he explained, as too many resources are dedicated to business units that generate only small percentages of the overall business revenue.
Management Analytics is process-agnostic, and Arshinov explained that the solution crosses groups within an organization, because “95% of the subsets for each group are the same. We look at what is the vertical functionality that’s needed for the last 5%,” he said. As an example, the notion of working in iterations has spread beyond the developer world, and it’s a concept that’s easily explained to business-side people.
But IT guys need to see dependencies and due dates, while project managers need a way to write requirements and integrate them into the system, and developers need to see their tasks and prioritize them, and report back on how the work is going.
“Let’s say an organization has a high-level task, setting up a new CMS system that’s accessible to customers,” Arshinov said. “That involves tasks across a large part of the company. Being able to see how each sprint is going is only tangentially useful” to the business big picture, he said.
Acunote, Arshinov said, can gather all the children and descendants from the data, using “some hard technical things we created” to present a high-level executive view via burn-down charts that can track progress by workgroup or project, even if plans change during the project.
Arshinov said Acunote sits at the intersection of two key industry trends: the fact that “everything is becoming data-driven, and the consumerization of the enterprise.” By aggregating large amounts of data and presenting it in ways that executives, project managers and developers can act on via the new Management Analytics solution, the business derives greater value from its teams, he said.


