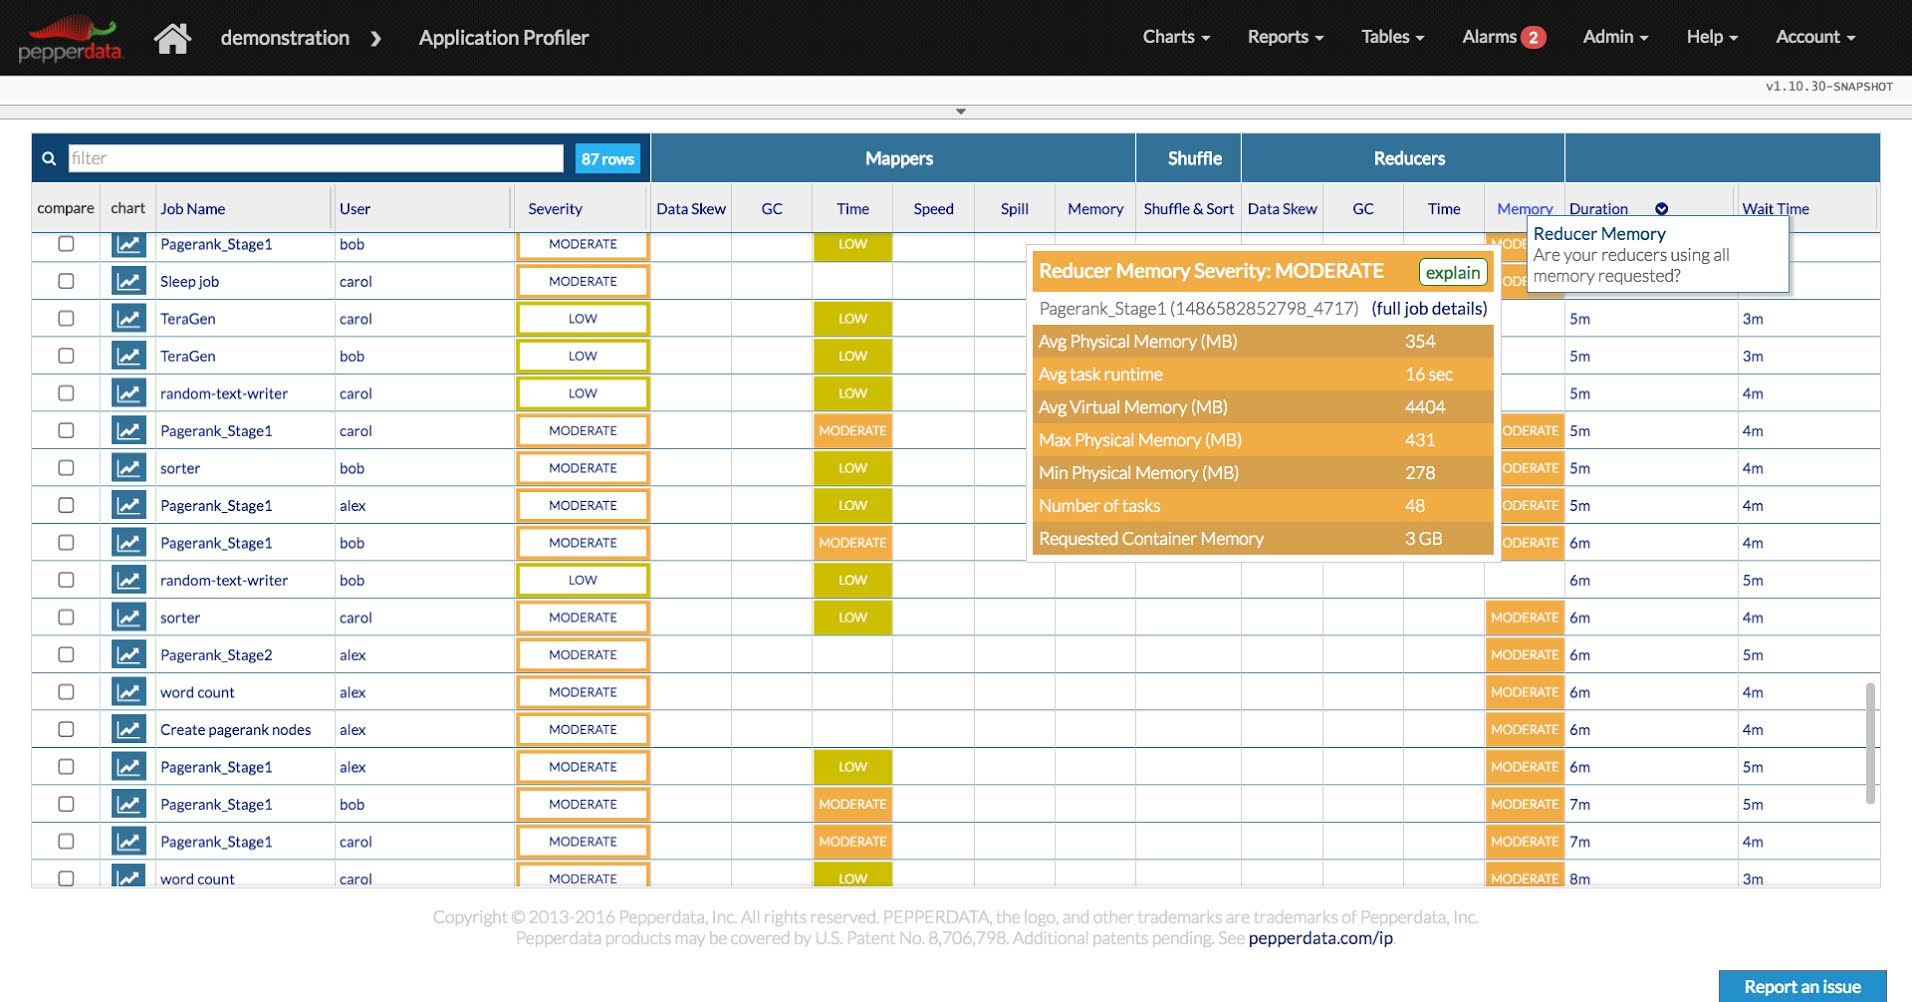
Pepperdata is expanding its tool set to include developers. Previously, the company offered tools for managing and administrating large datasets, but as of today, the company also offers Application Profiler, which is targeted at providing developers with performance feedback for their applications.
Available today in a preview to select customers, the Pepperdata Application Profiler will be fully available within the next few months. The tool is based on Dr. Elephant, an open-source monitoring and performance project created by LinkedIn.
(Related: Apache Ranger graduates to top-level project)
Ashfaq Munshi, CEO of Pepperdata, said that Dr. Elephant is a great tool, but it’s also completely standalone. “Traditionally, when people were deploying Dr Elephant, they had to run a different dashboard and deploy it. Ours is a SaaS offering, and it’s completely integrated into what we have today. In Dr. Elephant, a developer gets to see ‘This part of my job is taking a long time,’ but what developers want to know [is] what else was running on the cluster at that time. Stock Dr Elephant doesn’t provide that context, but Application Profiler does.”
Munshi said that this is the first tool the company has made specifically targeted at developers rather than operations. “Developers can get an understanding of everything that was happening at the time. The idea here is that the current products already help the Ops guys tremendously. When something happens and breaks on a cluster, our Cluster Analyzer gives them a speed improvement to find those problems. Application Profiler doesn’t need to be used by developers; it can be used by Ops guys to go to the developers and say you need to change this,” he said.
Munshi added that, while Application Profiler is separate from Dr. Elephant, the team at Pepperdata is still contributing its changes back upstream to the project itself.