DevOps and Agile are common practices, but they’re not enough to ensure the timely delivery of value to the business. While DevOps improves software delivery from code commit to code release and Agile improves the ability to create value via improved delivery timeframes, complete insight into the value that software teams deliver tends to go missing. Also missing is a business-level view into what’s happening in the software delivery process.
“To stay competitive, you need a handle on the end-to-end value flow through each product’s software delivery value stream,” said Nicole Bryan, Tasktop’s VP product. “Software is not the core competency of most enterprises, yet software is critical to their success. Tasktop helps software delivery organizations generate more value by connecting and measuring end-to-end flow.”
“The first step to understanding, managing and measuring end-to-end flow is integrating your tool chain,” said Bryan. “Tasktop enables enterprises to integrate all of the tools and teams in the software delivery process. If you can see and measure flow, you can improve it,” Bryan added.
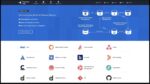
Integrate the DevOps tool chain
Large organizations rely on multiple tools to design, develop and operate software, with each tool designed to increase productivity of a specific role. “Software is not just about writing code,” said Bryan. “There are tools for planning, prioritizing, analyzing and designing requirements, testing, scanning, and deploying.”
Tasktop enables data exchange and synchronization across these tools to eliminate manual duplication, human-errors and delays and gain unprecedented visibility into the entire software delivery process to help business and IT leaders identify costly bottlenecks and opportunities to improve.
“You can’t fix bottlenecks if you don’t have visibility into the entire flow,” said Bryan. “If you’re not integrating all tools and teams, it’s impossible to see what is actually going on.”
“Organizations must make assumptions about what they can do to improve, because they don’t have the complete picture. They may decide to improve their testing process, when actually it’s their design process that is the bottleneck. Without end-to-end visibility, they can’t know that. Tasktop shines a light on the entire system, to help them to identify where investments will truly move the needle.”
Prove value in business terms
One of the biggest challenges IT organizations face is finding a common language with the business.
“The business thinks about the value they’re bringing customers and the business outcomes they are trying to achieve,” said Bryan. “IT thinks about how to get it done using existing resources. That requires breaking the work down into many technical tasks and implementation details. Tasktop helps IT see those details while abstracting them to concepts of value, which the business understands.”
“Software delivery organizations need to account for the business value they create, which is expressed in features delivered, defects fixed and security issues resolved,” said Bryan. “When viewed side by side with desired business outcomes, IT and business leaders can make joint decisions on how to improve, adjust and calibrate to meet objectives. That’s what value stream management is, and what IT leadership is looking for.”
Five key metrics
There are five Flow Metrics that measure how value flows through a product’s value stream. They are calculated on four Flow Items – units of work organizations should want to measure: features, defects, debt, and risk. Any work a software delivery organization undertakes can be categorized as one of these core Items.
The Flow Metrics are:
- Flow Velocity: The number of Flow Items of each type completed over a period of time.
This metric is used to gauge whether value delivery is accelerating. Also referred to as throughput. - Flow Distribution: The ratio of the four Flow Items completed in particular window of time.
This metric is used to prioritize specific types of work during specific time frames to meet a desired business outcome. - Flow Time: The end-to-end time interval it takes for Flow Items to go from ‘work start’ to ‘work complete’, including active and wait times. This metric identifies when time to value is getting longer.
- Flow Load: The number of Flow Items in progress (active or waiting) within a value stream. This metric monitors over or under-utilization of value streams.
- Flow Efficiency: The percentage of time Flow Items are actively worked on out of the total time elapsed. This metric identifies when waste is increasing or decreasing.
More than 1,000 organizations around the globe, including 43 of the Fortune 100 and 300,000 customers, rely on Tasktop to accelerate their software delivery capabilities. For more information visit www.tasktop.com.
Content provided by SD Times and Tasktop