Advanced analytics database provider Kinetica wants to tackle the Internet of Things and its data analytics tsunami with a new graphical processing unit (GPU) approach. According to the company, the IoT is expected to reach $470 billion in revenue by 2020 from 30 billion or more IoT devices. In order to access and do more things at the edge, enterprises need to turn their data into actionable insights.
Kinetica started out in 2009 in the United States Army Intelligence and Security Command space. Its mission was to help the US Army and NSA track and capture terrorists as well as discover other national security threats. To do that, they needed to correlate a number of different data feeds together and come up with a high probability of where a terrorist target would be in real time. To meet their needs and provide fast data with the ability to scale, Kinetica created a new database around parallelization utilizing the GPU.
RELATED CONTENT: Climbing the IoT data mountain
Today, Kinetica is trying to bring the lessons learned from the US Army to the enterprise. “We started as a geospatial and temporal computational engine for any data that dealt with space and time. Through the years we became a full-fledged, highly available database. Many of the challenges we saw in the military, we are seeing now in the commercial space as this IoT phenomenon is becoming more and more prevalent,” said Amit Vij, CEO and founder of Kinetica. By taking traditional database operations and accelerating them with GPUs, Vij explained, the company has been able to provide 100 times performance on a tenth of the hardware.
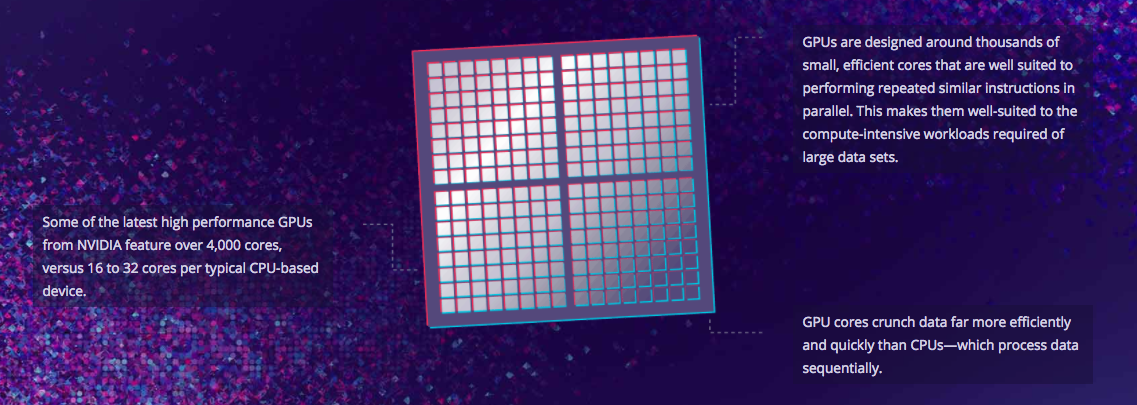
According to Vij, a GPU approach provides more than 4,000 cores per device to enable fast, real-time and predictive analytics while traditional CPU-based solutions provide about 16 to 32 cores per device.
Kinetica can be used for connected cars, fleet management, infrastructure, smart grid, customer experience, and just-in-time inventory. The company has worked with the United States Postal Service (USPS) to help track carrier movements in real time and become more proficient and accurate in delivering on time. The company was able to do this based on personnel, weather and traffic data.
Other features include geospatial data, time-series data, sensor data, structured data, machine learning, deep learning, location-based analytics, geospatial visualization, third-party integration and real-time visualization.


