Due to the rise of deep learning and therefore its complexity, Microsoft is open-sourcing TensorWatch, its AI debugging and visualization tool that it calls the “Swiss Army knife of debugging tools.”
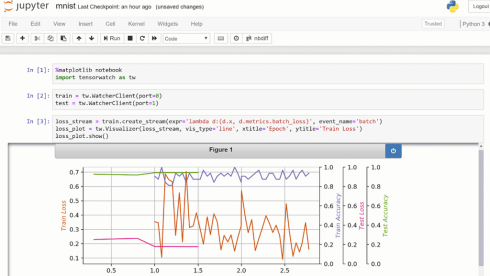
The tool works in Jupyter Notebook, which forfeits the need of using a separate script, according to the company. It shows real-time visualization of machine learning training and perform several other key analysis tasks for models and data. It is also a Python library that enables uses to build custom UIs or use TensorWatch in their Python data science research.
“The rise of deep learning is accompanied by ever-increasing model complexity, larger datasets, and longer training times for models. When working on novel concepts, researchers often need to understand why training metrics are trending the way they are. So far, the available tools for machine learning training have focused on a ‘what-you-see-is-what-you-log’ approach,” Microsoft’s research team wrote in a blog post.
TensorWatch aims to solve this by executing arbitrary queries against live ML training process, returning a stream as a result of the query and the ability to choose what visualizer to use, in addition to the ‘what-you-see-is-what-you-log’ approach.
The tool also adds a new method of debugging called lazy logging mode. “This mode doesn’t require explicit logging of all the information beforehand. Instead, you can have TensorWatch observe the variables,” researchers wrote. Lazy logging gives developers the ability to query the live running process, retrieve the result of this query as a stream and direct this stream to a preferred choice of visualizations.