Gradle has announced a new reporting feature in its developer productivity platform Develocity (previously called Gradle Enterprise).
The new dashboard can provide developers quicker insights than previously accessible in the platform, and it’s now easier to navigate.
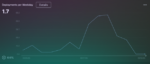
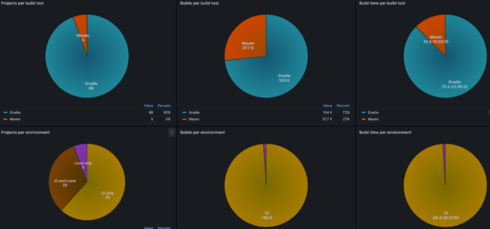
Develocity Reporting and Visualization provides information such as the number of projects using each supported build tool, the number of builds in CI vs local, the number of failed vs successful builds, JVMs used across all builds, which Git repositories are being built in which environment, and more.
“Some of this data was previously available within Develocity’s dashboards, but now there’s much more data available and it’s much easier to explore from within Grafana. Since Grafana itself is a data visualization tool that many are already familiar with, we hope our customers can easily begin exploring this data right away,” Trisha Gee, lead developer advocate for Gradle, wrote in a blog post.
This new feature is available as part of Develocity 2024.1, which was released in April and is the most current release.
According to Gradle, Develocity Reporting and Visualization is on a faster release cycle than the main platform, which will enable the company to make improvements quicker. Currently the team is working on adding support for more environments and adding more data types.
You may also like…
- Podcast: How cognitive fatigue impacts developer productivity (with Gradle’s Hans Dockter)
- How data should inform modern platform development