Daniella Pontes, senior product marketing manage of InfluxData:
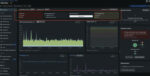
InfluxDB time series database offers a platform where today’s highly complex application environments (ephemeral containers, distributed apps in hybrid and multi-cloud, mobile applications, expanding APIs and such) can be effectively monitored. InfluxDB provides a scalable time series store that ingests data types (application metrics, logs, tracing and more) together with a real-time analytical engine that can process these data in complex ways. InfluxDB’s data enrichment and advanced operations takes high-volume raw data from multiple sources and delivers information as needed to be presented to the various audiences in order to be actionable.
When early signs of degradation or anomalies are detected in important KPIs monitored with InfluxDB platform, the diagnosis analysis comes into place and integration with an existing bytecode APM solution could provide quick access to what could be a root-cause in the application code. This way customers can use application performance monitoring and instrumentation in a more effective, focused and manageable manner.
Ivo Mägi, CEO of Plumbr:
Most organizations today are facing operating in DevOps, dynamic infrastructure or microservices environments. Against these institutional changes most monitoring tools fail by just working in the background to protect brands against outages in service. An APM fit for the era of digital transformation, though, guides you in proactively helping improve app performance with a focus on increasing user engagement and transactions, as well as ensuring that engineers are adding value rather than fighting fires.
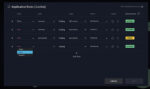
Plumbr APM simplifies the act of discovering, verifying, fixing and actively preventing issues through four key features:
– Actionable alerts based on user data.
– Distributed tracing for all and every request in your stack.
– Root-cause detection that, unlike other APMs, dives to the exact line of code that needs fixing.
– Impact analysis to show were the biggest ROI lies for connected business outcomes.
This allows users to trace every user interaction done in the UI throughout distributed traces in your back end monitored by the APM down to the bottleneck or error that’s actually hindering the user experience, and then being able to rank those bottlenecks and error based on the impact they have on users.
Denny LeCompte, general manager of application management at SolarWinds:
For 20 years, SolarWinds has been committed to the technology professionals we serve and to understanding their challenges and how they want them addressed. And when it comes to APM, the main thing we see customers looking for is an integrated solution.
Over the last few years, SolarWinds has brought together best-of-breed products and tightly integrated them into a full-stack APM Suite made up of Pingdom, AppOptics, and Loggly.
We shoot for every product to be the best value in the market so we have all the features that almost everybody needs. It’s important for all of the SolarWinds products to bring an affordability and ease-of-use element to the whole equation that helps you either save money or stretch your monitoring farther so that you can monitor more of your vertical apps out-of-the-box.
Pingdom offers the outside looking in perspective with web app performance and user experience monitoring, AppOptics delivers application performance and infrastructure monitoring, and Loggly completes the full-stack picture with log analysis and management. Altogether, the SolarWinds APM Suite helps solve application problems faster and easier with unified visibility across user experience, infrastructure, metrics, traces, and logs.