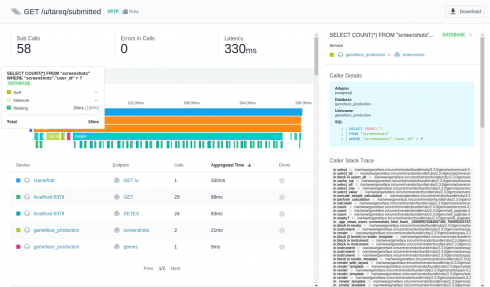
Instana is giving developers a new way to capture and trace user requests across languages and microservices. The APM company announced AutoTrace, designed to analyze traces from any source including open-source technologies, Jaeger, and Zipkin. In software, tracing is a form of logging and recording information about tasks or executions.
“As DevOps teams are adopting containers and Kubernetes, the initial approach to understanding application performance is for developers to build their own tracing using OpenTracing and Jaeger. But as the number of microservices start to grow, this approach does not scale well and takes too much effort,” said Pete Abrams. “We wanted to offer a way to repurpose those initial efforts yet seamlessly align those traces with our automatic tracing approach powered by our AutoTrace technology.”
According to the company, AutoTrace will be able to provide deeper analysis with its Trace Analyzer, which is designed for combining and correlating data from individual traces to search for patterns and improve performance and stability, the company explained. “ Users can use Trace Analyzer to optimize overall performance, locate and eliminate bottlenecks or solve production application performance issues or outages,” Instana wrote in its announcement.
Other features include support for Jaeger, Zipkin, OpenCensus and OpenTracing.
“With Instana AutoTrace all you have to do is install a base agent (process on a host, docker container, or Kubernetes DaemonSet) and Instana will automatically discover your running applications, creating the required observability. Every individual request is monitored and a distributed trace is created automatically for each of them by Instana AutoTrace,” Jim Hirschauer, Instana director of product marketing, wrote in a blog post.


