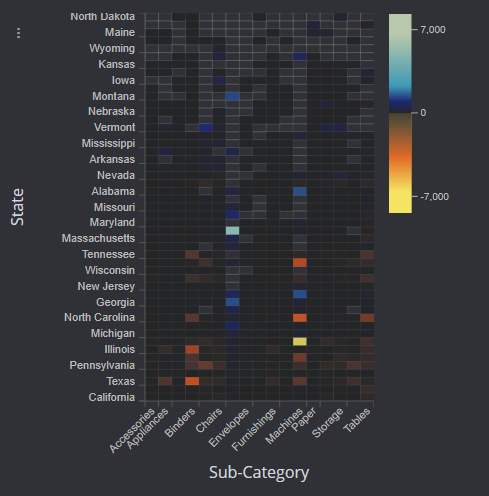
As data science becomes more and more important, so does data visualization. Data is practically useless if you don’t have a human-readable way of communicating the insights from that data with the business.
This week, we’re highlighting Perspective, which is an open-source tool for creating interactive visualizations of large, real-time datasets.
Perspective is a project hosted by the Fintech Open Source Foundation (FINOS), a nonprofit that is working to accelerate collaboration and innovation in the financial services sector. They do this by encouraging the adoption of open-source software, standards, and best practices.
RELATED CONTENT:
Data scientists need to be good storytellers
Report: Organizations are struggling to perform business analytics on growing data volumes
Perspective can be used to build reports, dashboards, notebooks, and applications. It has a fast, memory-efficient query engine and offers read/write/stream support for Apache Arrow.
It also features a framework-agnostic query configuration UI and a suite of simple visualization plugins for common JavaScript libraries like D3FC and Hypergrid.
FINOS hopes that financial services firms utilize Perspective to increase access to data, enhance visualization, and create better reports.


