dynaTrace, an application performance management tool maker, has updated its solution to dig deeper into .NET applications, enabling broader support for Microsoft’s development stack.
dynaTrace 3.2 introduces the ability to trace transactions within the .NET Common Language Runtime (CLR), including background and worker threads, said Andreas Grabner, senior architect and technology strategist for dynaTrace.
Prior to this release, tracing was limited to following a transaction between runtimes, he explained. “We built this requirement for BizTalk; it’s very service oriented…It is important to follow transactions across thread boundaries in SOA.”
dynaTrace 3.2’s new tracing capability enables it to better support Microsoft BizTalk Server and SharePoint applications by examining what occurs within CLRs, Grabner said.
Version 3.0 of dynaTrace, released in February 2009, added the ability to trace transactions across geographically distributed systems, including large server clusters and virtualized environments. dynaTrace supports both Java and .NET applications.
Building on the integration framework included in version 3.0, dynaTrace now also provides preconfigured deployment packs for Microsoft infrastructure components, including BizTalk Server, IIS, SharePoint and SQL Server. The new CLR tracing technology in dynaTrace 3.2 helped make those integrations possible, said Eric Senunas, senior director of marketing and communications at dynaTrace.
For example, the SharePoint deployment pack offers unique views of transactions for architects and developers. Developers have a view into what SharePoint APIs are calling a database, and architects can see which Web Parts are used when a service is called, Grabner explained.
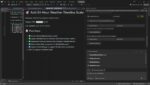
dynaTrace also has new integrations for Visual Studio 2010 and Systems Center Operations Manager.
Visual Studio 2010, due out in April, introduces an extensions interface for third-party developers. dynaTrace plugged its solution into Visual Studio’s testing results viewer.
“Developers can run a one-hour load test that finds five problem transactions,” Grabner said. “We then show the dynaTrace tab in the results to them to click on to open the dynaTrace client. It’s a single click to PurePath,” dynaTrace’s transaction tracing technology.