Lucid Software wants to make it easier for developers to create diagrams and mockups of their infrastructure, applications and flowcharts. The company recently announced a new automated AWS mapping feature for its Web-based application diagram solution Lucidchart.
“One of the directions where we are headed more and more as a product and team is how can we help developers get to where they want to go even faster,” said David Grow, vice president of product and strategy at Lucid. “We are working on how we can take existing structure data and help people easily pull that in, visualize it and then continue to manipulate it if they need to.”
Lucidchart is a collaborative diagraming application designed to help developers communicate ideas visually and describe what their network looks like today, where they want to go and what their vulnerabilities are.
“Lucid is really attractive to developers because it helps them work in an efficient environment in the kind of way they like to work, which is low overhead to get it going, collaborative and not cost-prohibitive,” said Brian Pugh, vice president of engineering at Lucid Software. “Developers really get attracted to the tools that not only do the job well, but let them get in, get out and not get in their way.”
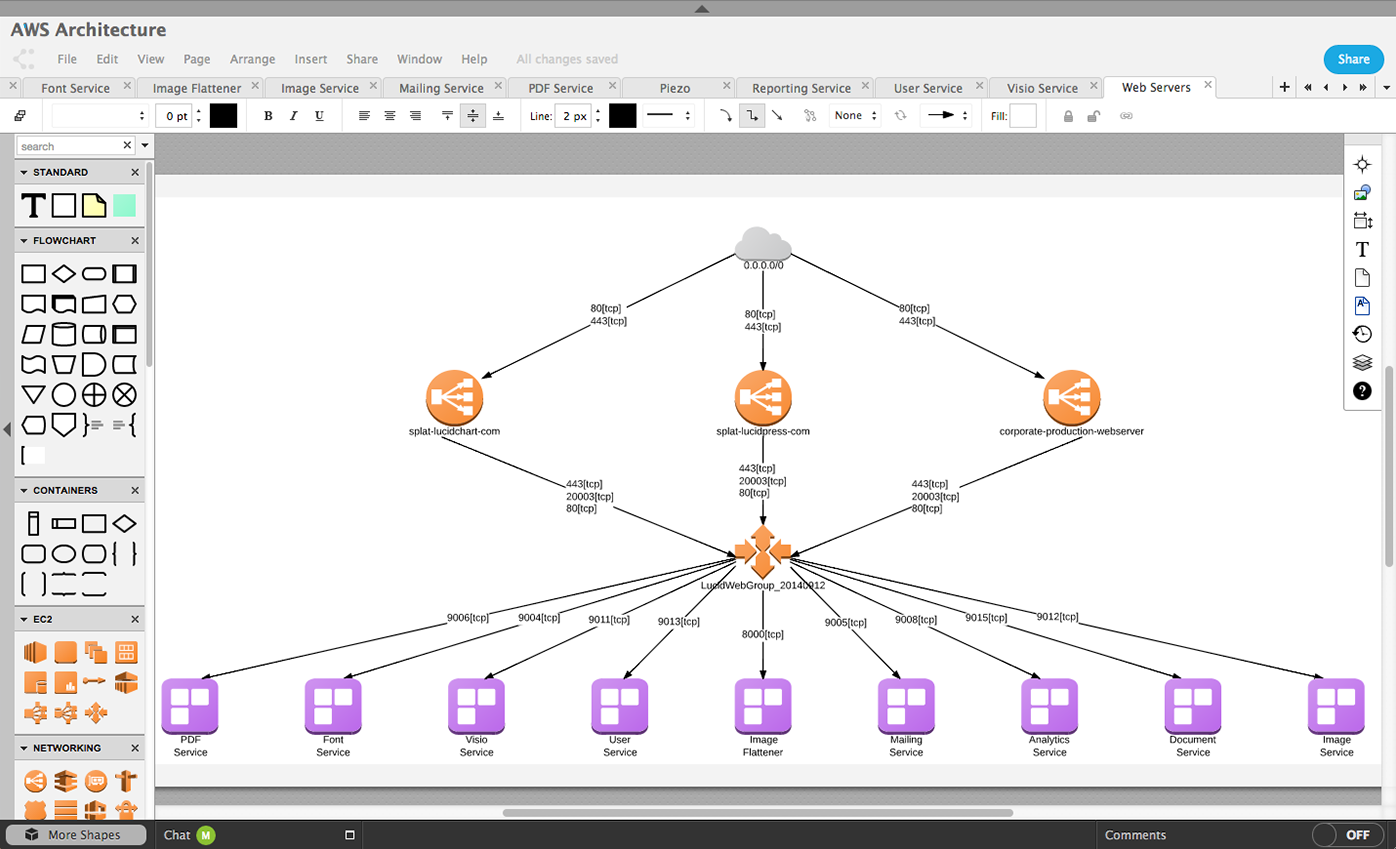
The new mapping feature, currently in closed beta for AWS, takes Amazon’s specific stencils and shapes that represent different components used in an AWS infrastructure and makes them part of Lucidchart’s native shape library. The feature provides developers with a script that calls AWS APIs to determine what their infrastructure looks like and what assets they are using from AWS, and automatically generates a diagram.
“Rather than spending hours adding each of their AWS assets to a manually created diagram, AWS customers can instead walk through a few simple steps in Lucidchart and within a few minutes have their AWS infrastructure represented in a professional looking, editable diagram.”,” said Grow.
According to Grow, the feature is necessary because a static diagram can become out-of-date within weeks or hours depending on updates and service changes an organization makes to their infrastructure.
“This makes it very easy in one or two steps to automatically update a diagram by running the script and bringing it back into Lucidchart,” he said.
The AWS beta is step one in Lucid’s plans to automate the complex diagramming process for developers. The next step is to be able to update diagrams on the fly for customers.
“We want to make it possible for developers to go into Lucidchart at any time, come and see what their infrastructure looks like at that very moment rather than what it looked like when they created the static diagram,” said Grow.
More information is available here.