Google has announced new application performance management (APM) capabilities for developers with the introduction of Stackdriver APM and Stackdriver Profiler. These APM solutions are designed to give developers distributed tracing, debugging and profiling tools for their code.
According to the company, the APM tools are the same tools Google uses internally to monitor and fine tune their own apps. “Here at Google, we’re developers too, and we know that tracking down performance problems in your code can be hard—particularly if the application is live,” Morgan McLean, product manager for Google, wrote in a post.
Stackdriver Profiler is a production profiling solution that measures the impact of functions and code to determine an application’s overall performance. “If you don’t analyze code execution in production, unexpectedly resource-intensive functions increase the latency and cost of web services every day, without anyone knowing or being able to do anything about it,” McLean wrote. The profiler features the ability to analyze code execution, continuously run, uses statistical methods, minimizes the impact on targeted codebases, and identifies and remediates performance projects. The profiler is currently in public beta.
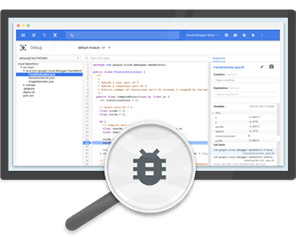
The Stackdriver APM solution consists of Stackdriver Trace and Stackdriver Debugger. Both are generally available today. StackDriver Debugger is a real-time application debugging solution. It features debugging in production, multiple source options, the ability to collaborate while debugging, debug snapshots, debug logpoints, conditional debugging and integration into existing developer workflows. “Without Debugger, finding these kinds of problems usually requires manually adding new log statements to application code, redeploying any affected services, analyzing logs to determine what is actually going wrong, and finally, either discovering and fixing the issue or adding additional log statements and starting the cycle all over again,” McLean wrote.
Stackdriver Trace is designed to reduce latency by analyzing customer requests and performing root cause analysis. “Trace continuously samples requests, automatically captures their propagation and latency, presents the results for display, and finds any latency-related trends. You can also add custom metadata to your traces for deeper analysis,” McLean wrote.
Trace is based off the company’s large-scale distributed tracing solution Dapper.
In addition, the company announced integrations between Stackdriver Debugger, GitHub Enterprise and GitLab.
“All of these tools work with code and applications that run on any cloud or even on-premises infrastructure, so no matter where you run your application, you now have a consistent, accessible APM toolkit to monitor and manage the performance of your applications,” McLean wrote.