Grafana Labs is celebrating the 10-year anniversary of Grafana with the release of Grafana 10.
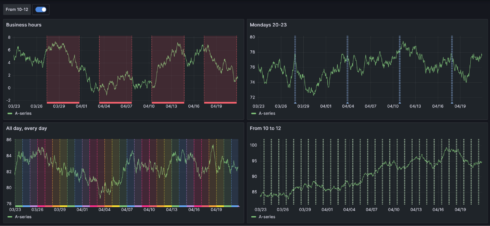
This release introduces new visualization capabilities via several new Grafana panels. These include the trend panel, which can graph ascending numeric X-axis data; and the datagrid panel, which provides a spreadsheet-like interface for editing data in the dashboard. The time series panel was also updated to allow you to add time regions.
Another focus of this release is team collaboration. Public Dashboards, which can be shared with external stakeholders, has been updated with the ability to collapse rows, hide queries, and zoom into panels. These Public Dashboards also now live in a separate category in the Dashboards section, making it easier to manage them.
The onboarding experience has also been improved to make it easier and quicker to install Grafana, set up data sources, and create dashboards. Users will now be provided with guided workflows and tips, and when setting up data sources users can utilize an updated data picker and better prompts.
“Observability data – in its early days, the domain of site reliability and platform engineering teams – has exploded in popularity with developers at large,” said Tom Wilkie, CTO at Grafana Labs. “Grafana 10 has elevated the developer UX for observability data so any developer can jump right in and get started connecting data sources, creating dashboards, and sharing and extending these resources to teammates.”
Another update is the introduction of subfolders, which can be used to organize dashboards into folders based on business units, departments, and teams.
Grafana 10 also includes updated security capabilities, such as improved Role-Based Access Control and streamlined SAML authentication.
Other updates include the new Correlations feature, which enables teams to link between data sources to provide a better view of the entire data landscape; a new frontend library called Grafana Scenes that can be used to build dashboards from Grafana app plugins; and a new interface that is just for managing dashboards as code.
To further celebrate the project’s 10-year anniversary, events happening include GrafanaCON and its associated local meetups happening in over 20 cities. There is also a documentary releasing later this year about the evolution of the project and community, and a teaser was released at GrafanaCON.