At its annual conference, GrafanaCon, Grafana Labs has announced updates to two of its open source projects (Grafana and Loki) and announced a new open source project (Grafana Alloy).
“Our goal is to make it easier and faster to get started for anyone – whether they’re landing on the moon or monitoring their daily commute – to get started with observability, and today’s announcements at GrafanaCON are another big step in that direction,” said Tom Wilkie, CTO of Grafana Labs. “Grafana users can build a fully composable observability stack with Loki as the data backend and Alloy as the data pipeline, which then brings that data into Grafana to visualize. This interoperable open source stack will help users achieve new levels of efficiency and insight.”
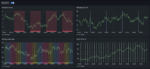
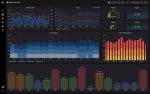
Grafana 11.0 adds several new features, such as Explore Metrics, which is a new query-less way of interacting with Prometheus metrics so that users can determine the root cause of issues, and Explore Logs, which is similar but for Loki logs.
Other updates include improved visualizations, simpler alerting, 11 new data sources, integration with Tempo and Traces, a new Grafana App Platform, and the ability to configure SSO from the UI.
Loki 3.0 introduces Bloom Filters, which allows queries to search text strings, like order ID and user ID. It also adds native support for OpenTelemetry.
Grafana Alloy, which is an open source distribution of OpenTelemetry Collector, was also announced. The company views it as a “Big Tent” collector that will bring data from Grafana, OpenTelemetry, and Prometheus together.
“We believe that organizations should own their observability strategy, choose their own tools, and have the freedom to bring all their data together in one view. Grafana Alloy helps you achieve just that as a telemetry collector that’s compatible with a suite of different signals that can meet a wide array of different needs,” Richard Lam, director of product at Grafana, wrote in a blog post.