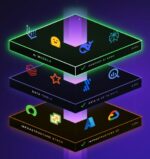
APM, as Gartner defines it in its Magic Quadrant criteria, is based on three broad sets of capabilities, and in order to be considered by Gartner an APM vendor, you have to have all three. Charley Rich, Gartner research director and lead author of its APM Magic Quadrant, explained:
The first one is digital experience monitoring (DXM). That, Rich said, is “the ability to do real user monitoring, injecting JavaScript in a browser, and synthetic transactions — the recording of those playback from different geographical points of presence.” This is critical for the last mile of a transaction and allows you to isolate and use analytics to figure out what’s normal and what is not, and understand the impact of latency. But, he cautioned, you can’t get to the root cause of issues with DXM alone, because it’s just the last mile.
RELATED CONTENT: Application Performance Monitoring: What it means in today’s complex software world
Digital experience monitoring as defined by Gartner is to capture the UX latency, errors — the spinner or hourglass you see on a mobile app, where it’s just waiting and nothing happens — and find out why.
Rich said this is done by doing real user monitoring — for web apps, that means injecting JavaScript into the browser to break down the load times of everything on your page as well as background calls. It also requires the ability to capture screenshots automatically, and capture entire user sessions. This, he said, “can get a movie of your interactions, so when they’re doing problem resolution, not only do they have the log data, actual data from what you said when a ticket was opened, and other performance metrics, but they can see what you saw, and play it back in slow-motion, which often provides clues you don’t know.”
The second component of a Gartner-defined APM solution is application discovery diagnostics and tracing. This is the technology to deploy agents out to the different applications, VMs, containers, and the like. With this, Rich siad, you can “discover all the applications, profile all their usage, all of their connections, and then stitch that together to what we learn from digital experience to represent the end-to-end transaction, with all of the points of latency and bottlenecks and errors so we understand the entire thing from the web browser all the way through application servers, middleware and databases.”
The final component is analytics. Using AI, machine-learning analytics applied to application performance monitoring solutions can do event correlation, reduce false alarms, do anomaly detection to find outliers, and then, do root cause analysis driven by algorithms and graph analysis


