Infragistics has announced the latest release of its UX/UI platform, Infragistics Ultimate. The 24.1 release includes new features such as React code generation in App Builder, advanced Grids for major web frameworks, and better data visualizations.
“Whether you’re a solo developer or part of a large digital product team, Infragistics Ultimate offers the tools you need to create beautiful, high-performance apps more efficiently,” said Jason Beres, SVP of developer tools at Infragistics. “Our new iteration brings a host of new features that significantly improve, streamline and modernize app building.”
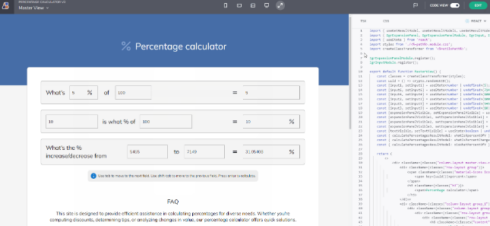
The low-code platform App Builder now has the ability to generate code for React, which simplifies the design-to-code process for developers building with that framework.
App Builder also now has the concepts of Variables, State Management, and Selection events, which will enable Master-Detail design patterns to be created within the platform, which wasn’t previously possible. Master-Detail shows two views: a list of records and a view that expands data about a single record.
Infragistics Ultimate 24.1 also includes several framework specific updates, such as:
- Advanced state management, support for Angular 18, and a new Toolbar component in Angular
- A Hierarchical Grid for handling data, Pivot Grid for data analysis, and a Button Group component in Blazor
- A Hierarchical Grid, Tree Grid control, and a Button Group component in React
- A Hierarchical Grid, Pivot Grid, and improved DockManager in Web Components
There is also now a Chart Highlight Feature, which allows developers to create interactive charts where users can highlight specific chart data points so that they can analyze complex datasets. According to Infragistics, this makes data visualization better for both developers and their end-users.
And finally, Infragistics Ultimate 24.1 includes support for .NET 8, which offers benefits like faster startup times, reduced memory usage, and enhanced runtime. It also includes Funnel Chart Highlighting in Windows Forms and WPF to “make complex quantitative data more digestible.”
You may also like…
Software engineering leaders must act to manage integration technical debt
Generative AI development requires a different approach to testing


