The Angular team has announced the release of Angular DevTools, which is a Chrome DevTools extension. It can be used to help with debugging Angular applications.
Angular recently ran a survey of Angular developers and identified that the areas of the debugging experience that need the most focus include improvements in error messages, understanding change detection execution, understanding injector hierarchy and provider instantiation, and visualization of component structure.
RELATED CONTENT: Angular v12 now available
The initial release of the team’s DevTools focuses on visualization of component structure and providing an overview of change detection execution.
The component explorer allows developers to preview the structure of their application.
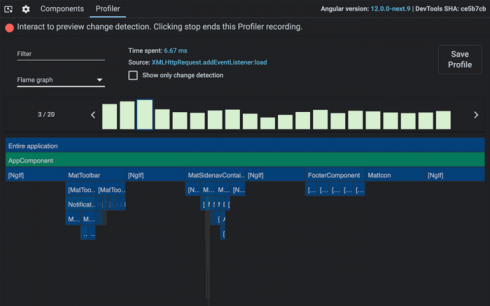
The profiler shows an overview of change detection cycles so that developers can understand where their bottlenecks are and eliminate them.
Angular DevTools was developed in collaboration with Rangle.io, which developed the first debugging tool for Angular, Augury.
Future releases of Angular DevTools will focus on filling in the functionality gap with Augury and adding the most requested features that would have the greatest impact on developer experience.
Other steps the team has taken to improve the debugging experience in Angular include adding new APIs to the global ng object and better error messages.


