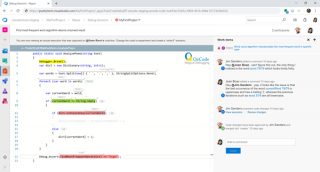
OzCode is on a mission to reduce the time it takes to debug a service from days to hours to minutes with its latest debugging as a service solution. OzCode provides debugging extensions for Visual Studio. Its latest OzCode Azure DevOps offering is available through Microsoft Azure cloud. “Studies show that roughly 50 percent of … continue reading
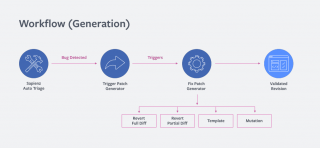
Facebook is introducing a new AI hybrid tool aimed at finding and fixing bugs automatically. SapFix is designed to find bugs, generate fixes and propose action plans to engineers before rolling out into production. The company announced the tool at its annual @Scale conference in San Jose this week. According to the company, SapFix significantly … continue reading

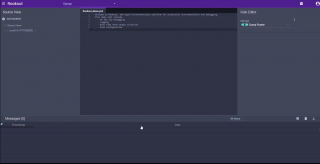
Debugging company Rookout has announced it is bringing its remote live debugging solution to Electron. Electron is an open-source framework for building web solutions with JavaScript, HTML and CSS. Rookout’s debugging solution will enable developers to gain insights into the data and code from a live Electron app, rather than having to gain the insights … continue reading
BrowserStack is announcing new debugging tools and native mobile functionalities to its web and mobile app testing platform. In addition, the company announced it is adding new devices to its Real Device Cloud coverage with support for Samsung Galaxy S9, S9+ and the 2018 Apple iPad. Support for iPhone 6, 6s, 6s Plus and 2018 … continue reading
Facebook has announced it will be open sourcing its extensible debugging tool: Sonar. Sonar was originally created to help Facebook engineers manage the complexity of working with multiple different modules. According to the company, Sonar provides a framework where experts and developers can convey important information to users. It also provides engineers with an intuitive … continue reading
Rookout has launched as a rapid debugging solution, and has secured $4.2 million in funding. With Rookout, developers can debug and understand issues in their code by collecting data on-demand, without needing to code, re-deploy, or restart their applications. Typically, the debugging process is complicated and lengthy, the company explained. It often involves writing additional … continue reading
Google has announced new application performance management (APM) capabilities for developers with the introduction of Stackdriver APM and Stackdriver Profiler. These APM solutions are designed to give developers distributed tracing, debugging and profiling tools for their code. According to the company, the APM tools are the same tools Google uses internally to monitor and fine … continue reading

Sauce Labs is introducing a new solution to provide better insights into app failures, and expedite fixes. The Continuous Testing Cloud is designed to enable developers to deliver high quality applications more efficiently with instant access to test coverage and analytics. “The Sauce Labs Continuous Testing Cloud meets the challenges of today’s competitive market by … continue reading
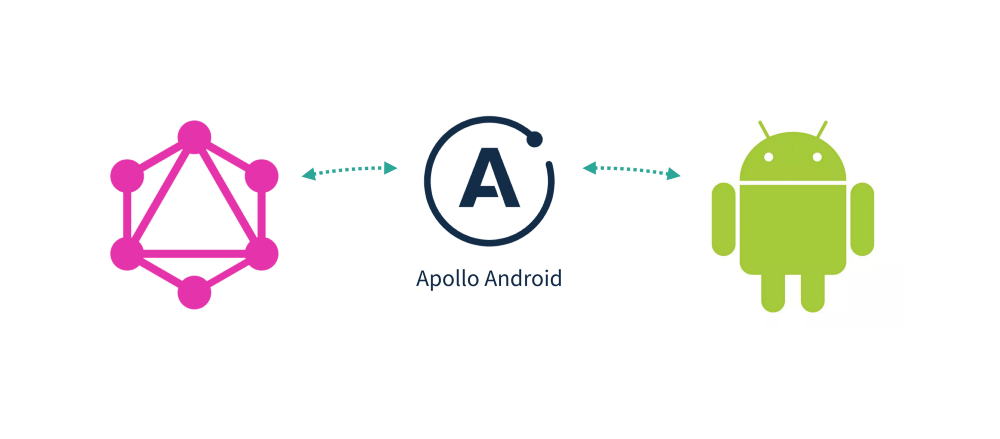
A new open-source project wants to help Android developers work with GraphQL queries. The Apollo Android Graph client is designed to generate Java models from standard GraphQL queries. “These models give you a typesafe API to work with GraphQL servers. Apollo will help you keep your GraphQL query statements together, organized, and easy to access … continue reading
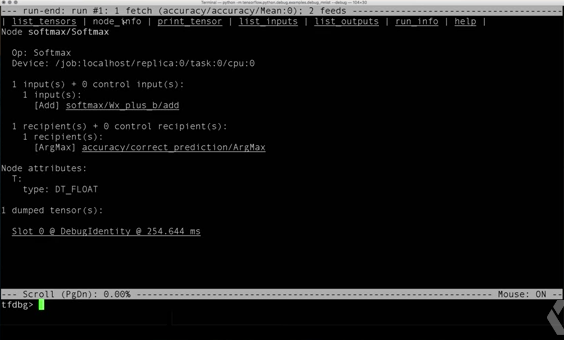
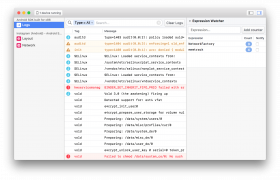
Google is introducing a tool designed to help developers debug machine learning models in TensorFlow. TensorFlow Debugger aims to provide visibility into the internal structure and state of TensorFlow graphs. According to the team, compared to other debugging options, TensorFlow Debugger requires fewer lines of code, provides more graph coverage, and offers a more interactive … continue reading

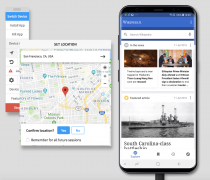
Stuck on how to get started building a financial services app? The Google Play/Finance team shared some tips this week on how to build high-quality and accessible financial services apps, featuring a six-step guide for making these apps accessible in the Google Play store. One tip in the guide is to test and iterate the … continue reading
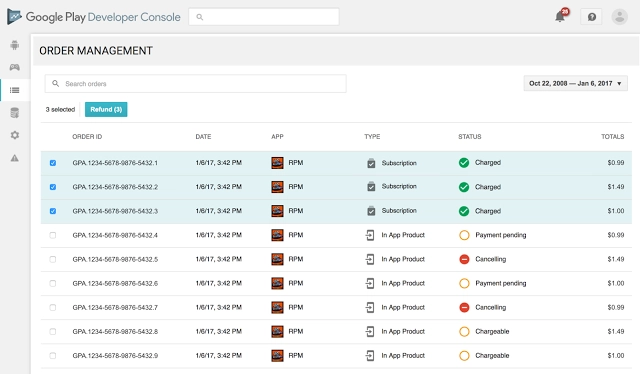
Google wants to help developers manage payments better. The company announced new improvements for developers with paid apps, in-app purchases, or subscriptions. Google will move order management to the Google Play Developer Console in order for developers to access payment settings easier. In addition, the company will add new features such as bulk refunds, subscription … continue reading